Load Testing Caddy Web Server on a GCP F1-Micro Instance Using K6 (k6.io)
March 24, 2020
Categories: Tags:TL;DR: I used the K6 load testing framework to benchmark the Compute Engine f1-micro and Caddy web server hosting this site. With Cloudflare caching turned off, the server was able to serve an onslaught of 800 virtual users continuously reloading the page (while maintaining a median request duration of <400ms), but started dropping requests when increasing the load further.

Table of Contents:
Background
DevOps Directive is a static website generated with Hugo and hosted using Caddy running on an f1-micro GCP Compute Engine instance with Cloudflare in front of it (see The Making of This Site post for details). On a normal day, the site used to get between 1 (thanks Dad!) and 20 visitors, but recently, two articles made it to the front page of Hacker News ( Link-1 and Link-2) bringing outsized swells in traffic.
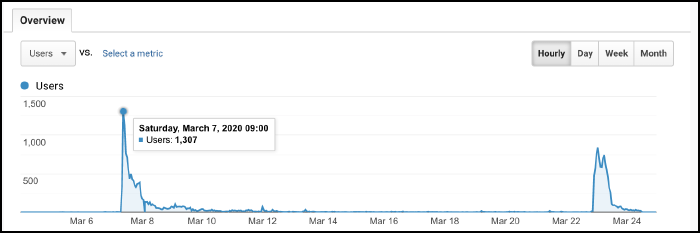
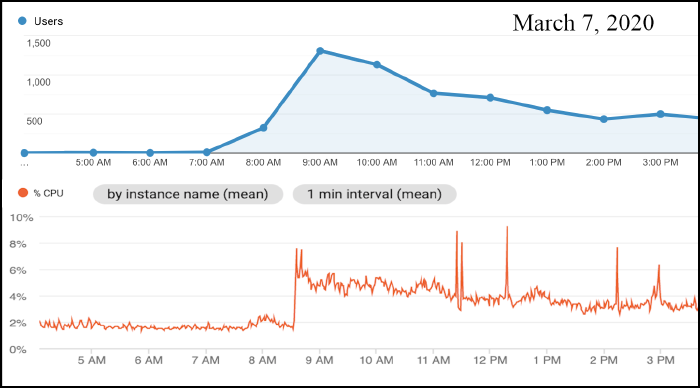
In a single hour on March 7th, a total of 1307 people visited this site ( from all over the world!). Thankfully, even with all of that traffic, CPU usage of the virtual machine never even reached 10% (and the short spikes correspond to redeploying the site with copy edits).
At this point, the setup has proven itself capable of embracing a Hacker News hug without dying, but I wanted to get a sense of what kind of load it can handle.
Testing
Site Setup
In order to avoid causing any impact to my actual site, I spun up an identical replica on a separate virtual machine using this script and configured the https://test.devopsdirective.com/ subdomain (which will likely be inactive at the time you are reading this) to resolve to it.
Here is a summary of the configuration:
- Compute Engine f1-micro Instance (0.2 vCPU burstable to 1 vCPU for short periods, 0.6GB Memory) running Container Optimized OS (COS)
- Caddy (1.0.3) container image with the site content files built directly into the container
- Cloudflare is configured to proxy traffic and set to the “standard” caching level (I performed tests with caching turned on and caching turned off)
NOTE: I didn’t tune/configure the COS image running on the VM, nor specify resource requests in the docker run command.
K6 Performance Testing Framework
To perform the load test I used k6.io, an open source performance testing framework designed for building automated tests with a straightforward javascript config file. It uses the concept of “virtual users” (VUs) which in their words are “glorified, parallel while(true) loops” to load test a site.

Replicating Current Peak
First, I created a script to approximate the load that the two HN posts brought. The peak hour had 1443 page views or 0.4 pageviews/second. To account for the load not being constant across the entire hour, I rounded this up to 1 pageview/second.
K6 is able to use a HAR file](https://en.wikipedia.org/wiki/HAR_(file_format)) to create a representative set of HTTP requests. I used 1 virtual user and adjusted the pause between iterations to achieve just over 1 pageload/second (with a “pageload” corresponding to the batch of HTTP requests). I excluded external requests for things like the Google Analytics script. The full K6 configuration script can be found as a GitHub gist and the resulting output can be seen below:
check_failure_rate.........: 0.00%   ✓ 0   ✗ 138
checks.....................: 100.00% ✓ 414 ✗ 0
data_received..............: 66 MB   549 kB/s
data_sent..................: 219 kB  1.8 kB/s
group_duration.............: avg=873.64ms min=850.89ms med=864.69ms max=1.13s    p(90)=891.35ms p(95)=908.24ms
http_req_blocked...........: avg=81.77µs  min=156ns    med=446ns    max=133.52ms p(90)=861ns    p(95)=1.42µs
http_req_connecting........: avg=7.06µs   min=0s       med=0s       max=11.69ms  p(90)=0s       p(95)=0s
http_req_duration..........: avg=26.89ms  min=12.6ms   med=23.11ms  max=213.29ms p(90)=38.19ms  p(95)=47.38ms
http_req_receiving.........: avg=726.31µs min=62.01µs  med=242.75µs max=29.96ms  p(90)=1.84ms   p(95)=2.41ms
http_req_sending...........: avg=52.23µs  min=11.27µs  med=38.27µs  max=4.07ms   p(90)=106.59µs p(95)=115.18µs
http_req_tls_handshaking...: avg=72.85µs  min=0s       med=0s       max=120.64ms p(90)=0s       p(95)=0s
http_req_waiting...........: avg=26.11ms  min=12.37ms  med=22.51ms  max=212.53ms p(90)=37.05ms  p(95)=45.32ms
http_reqs..................: 1656    13.799982/s
iteration_duration.........: avg=873.71ms min=850.96ms med=864.75ms max=1.13s    p(90)=891.46ms p(95)=908.31ms
iterations.................: 137     1.141665/s
vus........................: 1       min=1 max=1
vus_max....................: 1       min=1 max=1
Key Takeaways
- All requests returned successfully (
Status: 200 OK) - The request duration ranged from 13ms to 213ms
- The 95th percentile duration was 47ms
Ramping It Up!
With that test as a baseline, I proceeded to run a series of tests, each 60 seconds long, starting with 6 virtual users and increasing the number of VUs with each test. I also reduced the delay between virtual user iterations to 100ms. The most important metric is http_req_duration, which represents is the total request time (http_req_sending + http_req_waiting + http_req_receiving), which I have plotted below for the full set of tests.
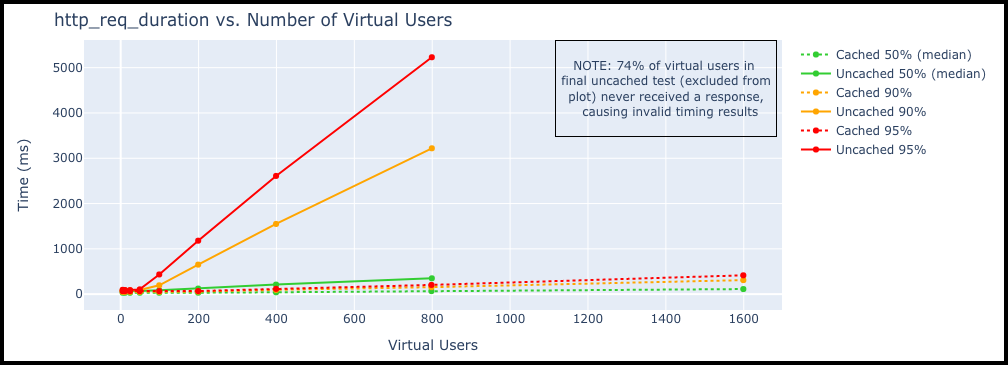
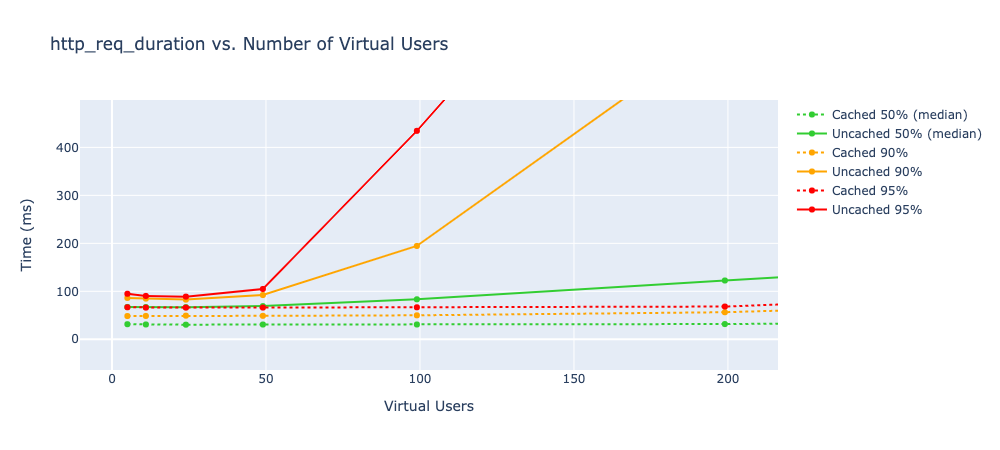
Up until around 50 VUs, the response time remains flat, with an uncached median of 68ms and a cached median of 31ms.
After 50 VUs, the response times begin to climb linearly. At 800 VUs the uncached median was 349ms and the cached median was 67ms. As would be expected at these higher loads, most (90+%) of the http_req_duration is spent in the http_req_waiting stage.
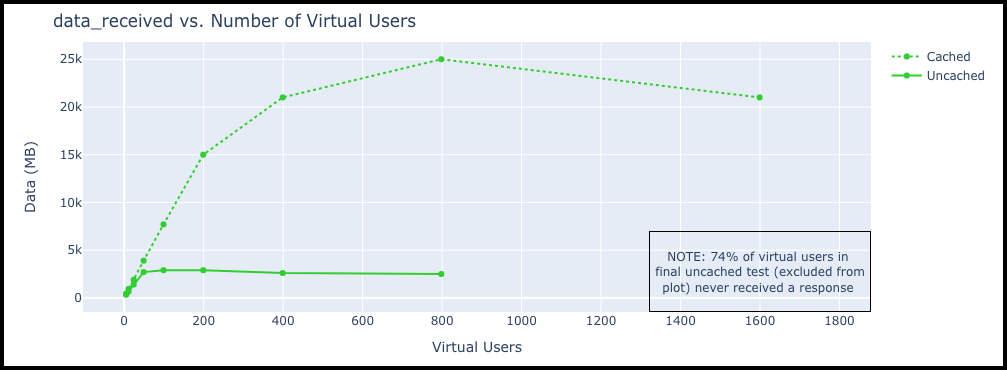
The uncached configuration finally gave out during the 1600 virtual user test, with only 414 successful responses, indicating that ~74% of the virtual users never received a response.
Virtual Users and Server Load
It is important to note that while the virtual users run in parallel with each other, they run in serial with themselves. Each individual VU waits until its current page load is complete before making a new set of requests. As the server slows down under load, this causes the total rate of requests to drop in the more demanding tests. The impact is clearly seen in the total amount of data received during the tests plotted below.
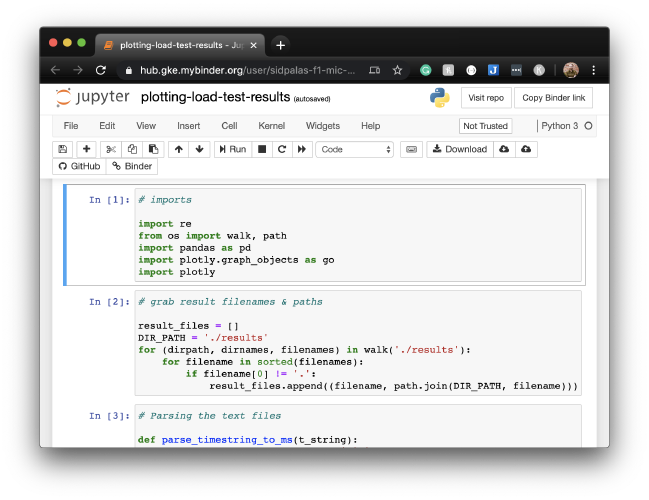
These were the two most informative plots, but all of the data and code to generate plots can be found in a notebook in this GitHub repo. You can load an interactive copy of the notebook using the following binder link:
Snags Along the Way
I did run into some technical limitations when configuring and executing these tests. Here are the main issues and how I overcame them:
-
Bandwidth Limitations: My home internet was not sufficient to support the load test. Moving to a GCP virtual machine with sufficient bandwidth (Measured @ 900+ Mbps) as the test client running K6 solved this. For the later tests in the cached configuration, this actually still became a limiting factor.
-
Memory Limitations: After moving from my laptop to an n1-standard-1 instance as the testing client, the more demanding tests caused K6 to run out of memory (
fatal error: runtime: out of memory). Moving to an n1-standard-8 (30GB memory) solved this. -
Unix Resource Limits: Because each request group makes multiple HTTP requests, the final test with 1600 target virtual users surpasses the default maximum number of open files allowed by the OS for a single process to manage at once. Using multiple test client VMs in parallel solved this, but increasing the open file limit with
ulimit -n <NEW_LARGER_LIMIT>is the approach I ended up using.
(Aside) Total Costs
The total cost to run this experiment was $2.82:
- $1.60 for 40.1 GB of network egress
- $0.50 for running the f1-micro server for a ~3 days
- $0.72 for running the n1-standard-8 testing client for a ~2 hrs
Conclusions
I am continuously amazed at the level of load that even such a tiny virtual machine can handle when serving static content!
Utilizing a service like Cloudflare to help cache and serve content reduces the load on the server significantly. It cut the response times in half under light load and prevented the server from being overwhelmed under heavy load.
I would have liked to record real-time resource (CPU + Memory usage) on the server VM but the GCP cloud monitoring agent isn’t compatible with Container Optimized OS, so I settled for the rough 1 min averaged view in the GCP console:
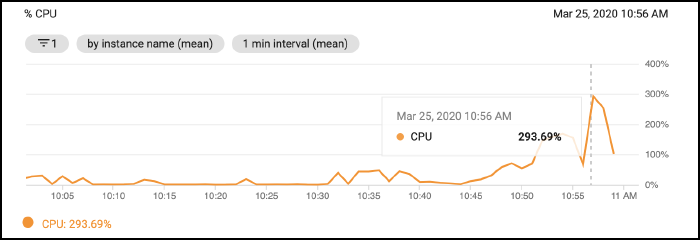
This test gives me confidence that my current server configuration should be able to handle quite a bit of growth before needing any major overhaul.
In the future, I hope to do similar benchmarking across other hosting options. If someone has a contact at @github or @netlify that could permit me to run a test against a Github Pages or Netlify Starter site let me know! Or maybe at @bluehost so I can benchmark some WordPress installs…